Normal Distribution
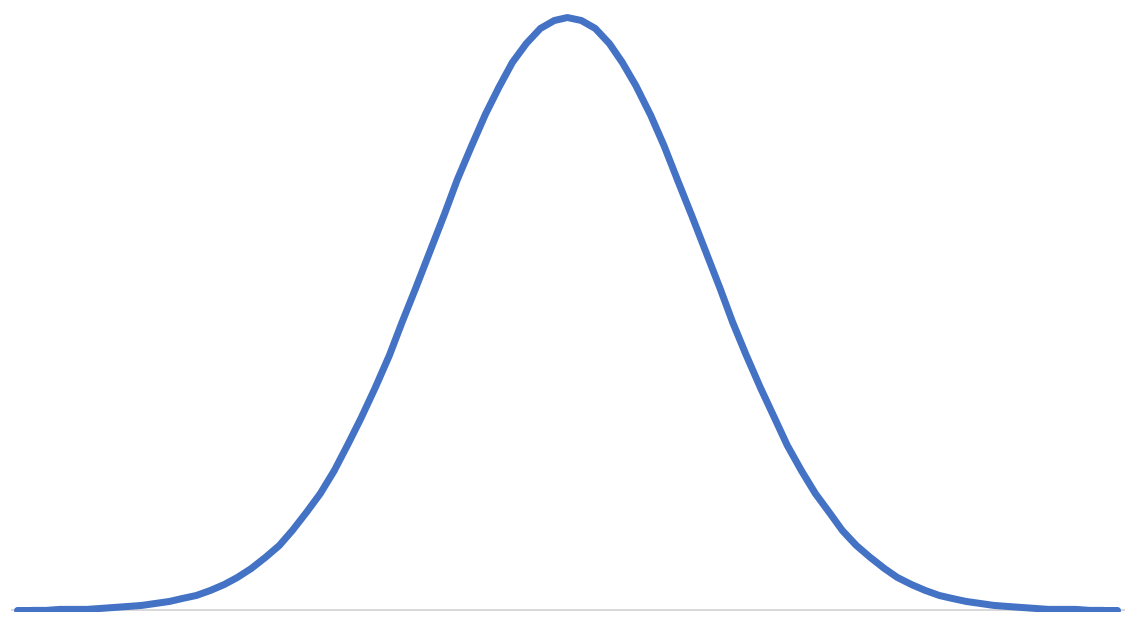
The first distribution most people are made familiar with is the Normal — or Gaussian — distribution. It makes sense, since many processes in the world can be approximated by a Normal distribution, and if they cannot then they surely can via the Central Limit Theorem.
In this section we will talk about normal distribution. We will be covering following topics
a. Why normal distribution is so important ?
b. Characteristics of normal distribution
c. Standard Normal Distribution
d. Z-score
e. Use cases on Z-score
f. Some problems on Z-score
g. Probabilities corresponding to Z-score and areas
h. Normal distribution Equation
i. Questions
Note:
1. We will be covering p-value, hypothesis testing and normality test in a separate section.
2. In this section we will be using z-table make sure you use the z-table mentioned in this note.
3. Some z-tables gives areas from mean and there are some other versions of z-table which
gives area from the extreem right of the distribution
4. We will be using the z-table which gives the area from mean
Terminologies:
1. Population: population has the complete data. But most of the time it will be very difficult or
impossible to collect population data.
For example: Age of all the people who watches cartton in the world
2. Sample: Since collecting entire population is impossible to achieve we offten take a part of the
entire population and call it as sample.
For example: We often use sample of the population for drug test
a. Why normal distribution is so important ?
Most high schools have a set amount of time in-between classes during which students must get to their next class. If you were to stand at the door of your statistics class and watch the students coming in, think about how the students would enter. Usually, one or two students enter early, then more students come in, then a large group of students enter, and finally, the number of students entering decreases again, with one or two students barely making it on time, or perhaps even coming in late!
Now consider this. Have you ever popped popcorn in a microwave? Think about what happens in terms of the rate at which the kernels pop. For the first few minutes, nothing happens, and then, after a while, a few kernels start popping. This rate increases to the point at which you hear most of the kernels popping, and then it gradually decreases again until just a kernel or two pops.
Here’s something else to think about. Try measuring the height, shoe size, or the width of the hands of the students in your class. In most situations, you will probably find that there are a couple of students with very low measurements and a couple with very high measurements, with the majority of students centered on a particular value.
All of these examples show a typical pattern that seems to be a part of many real-life phenomena. In statistics, because this pattern is so pervasive, it seems to fit to call it normal, or more formally, the normal distribution. The normal distribution is an extremely important concept, because it occurs so often in the data we collect from the natural world, as well as in many of the more theoretical ideas that are the foundation of statistics
Central Limit Theory: In probability theory, the central limit theorem establishes that, in many situations, when independent random variables are summed up, their properly normalised sum tends toward a normal distribution even if the original variables themselves are not normally distributed.
Remember: mean, median, mode, range, midrange, Inter Quartile range, variance , standard deviation, z-score etc these parameters apply to most of the distributions. based on the characteristincs of these parameters we give name to the distribution.
b. Characteristics of Normal distribution
If a distribution has following characteristics then it is called as normal distribution.
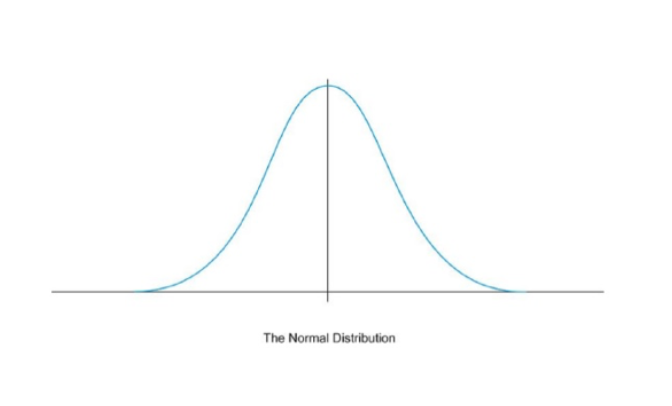
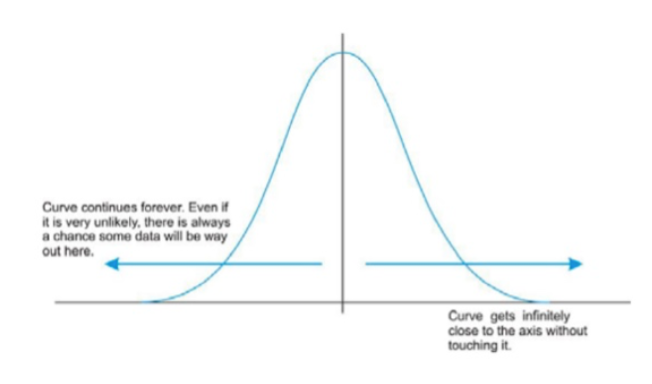
1. Shape: The shape should be symmetric and bell shaped
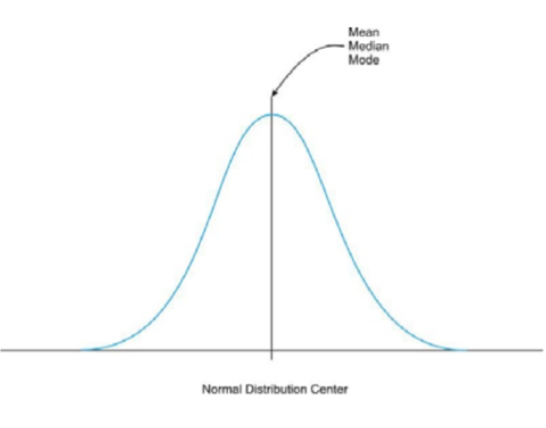
2 Center: All the statistical measures of central tendency (the mean, median, and mode) are equal.
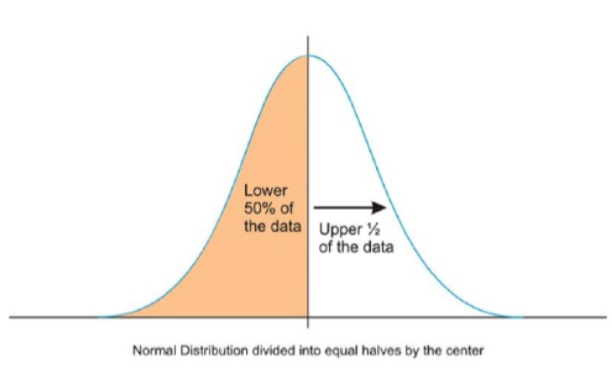
3. Mean: Mean divides the data into two equal parts
4. Spread: For the ND of a continuous random variable, the distribution continues infinitely in both directions.
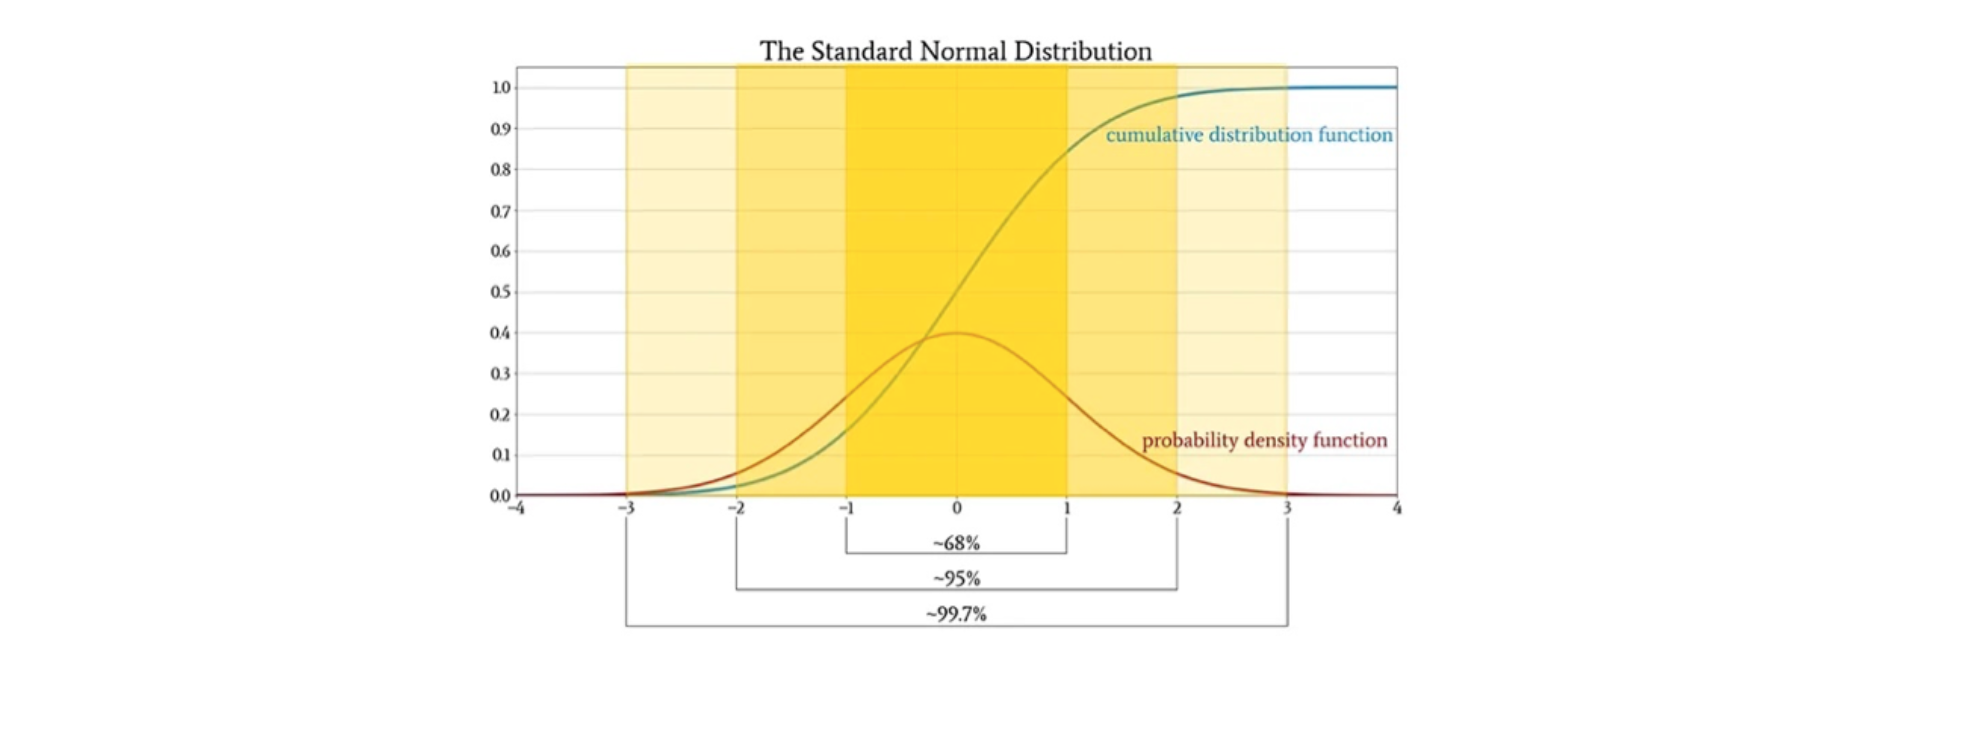
c. Standard Normal Distribution
Norma distribution with µ=0 and σ=1 is called Standard Normal Distribution.
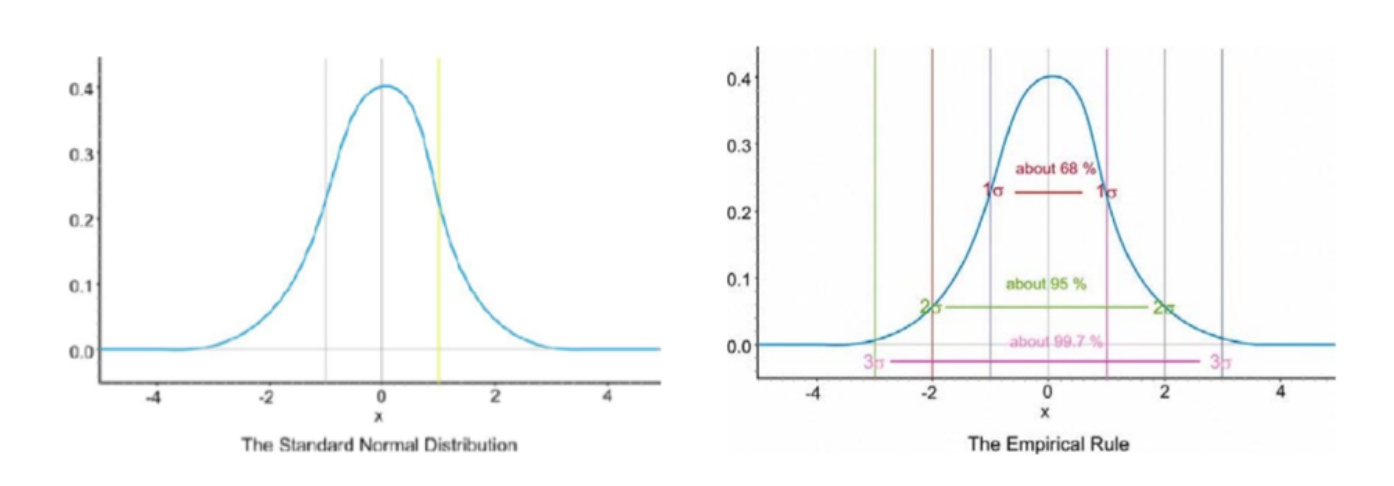
Notice that vertical lines are drawn at points that are exactly one standard deviation to the left and right of the mean. The Empirical Rule states that the percentages of data in a normal distribution within 1, 2, and 3 standard deviations of the mean are approximately 68%, 95%, and 99.7%, respectively.
d. Z-score
A z-score is a measure of the number of standard deviations a particular data point is away from the mean.
(Remember this can be applied to any distribution)
For example, let’s say
* the mean score on a test for your statistics class was an 82,
* with a standard deviation of 7 points.
* If your score was an 89,
* it is exactly one standard deviation to the right of the mean (or above mean);
therefore, your z-score would be 1.
For example, let’s say
* the mean score on a test for your statistics class was an 82,
* with a standard deviation of 7 points.
* If your score was an 75,
* it is exactly one standard deviation to the left of the mean (or below mean);
therefore, your z-score would be -1.
All values that are below the mean have negative z-scores, while all values that are above the mean have positive z-scores.

Z-scores range from -3 standard deviations (which would fall to the far left of the normal distribution curve) up to +3 standard deviations
e. Use cases of Z-Score
We will be discussing one use case where Z-score is widely used. In biostatistics probably the commonest use of Z-scores is in the analysis of human nutritional data, especially for children. Weight for age, height for age, and weight for height Z-scores are computed using international reference data intended to reflect human growth patterns under optimal conditions. Cut-off scores of -2 and -3 are used to identify children suffering from malnutrition. Mean Z-scores are used to evaluate the nutritional state of populations relative to the reference population
As mentioned in the research: here
They collected weights of girls who are 80 cm in heights and wanted to understand the girl with weight 8Kg is malnourished.
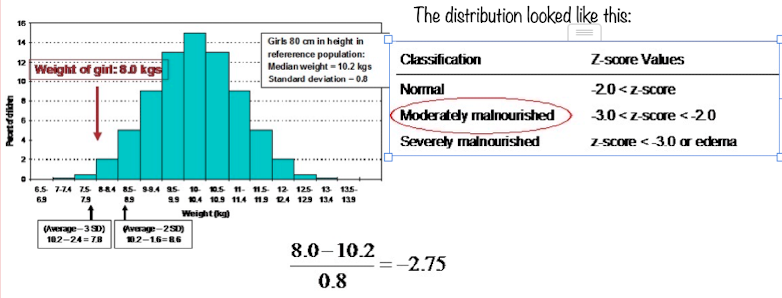
According to the reference girl with 8KG weight is moderately malnourished.
Z table - https://www.intmath.com/counting-probability/z-table.php
Z score is also used to find the correlation coefficient
f. Some problems on Z-score:
Problem 1: On a nationwide math test, the mean was 65 and the standard deviation was 10. If Robert
scored 81, what was his z-score?
z = ( x-µ ) / σ where x is score, σ is SD and µ is mean
= ( 81-65 ) / 10
z-score = 1.60
This states that Robert scored 1.60 standard deviation above the mean
Problem 2: On a college entrance exam, the mean was 70, and the standard deviation was 8. If Helen’s
zscore was −1.5, what was her exam score?
We can also write as:
x = µ + zσ
= 70 + (-1.5*8)
= 58
>
Thus, Helen’s exam score was 58;
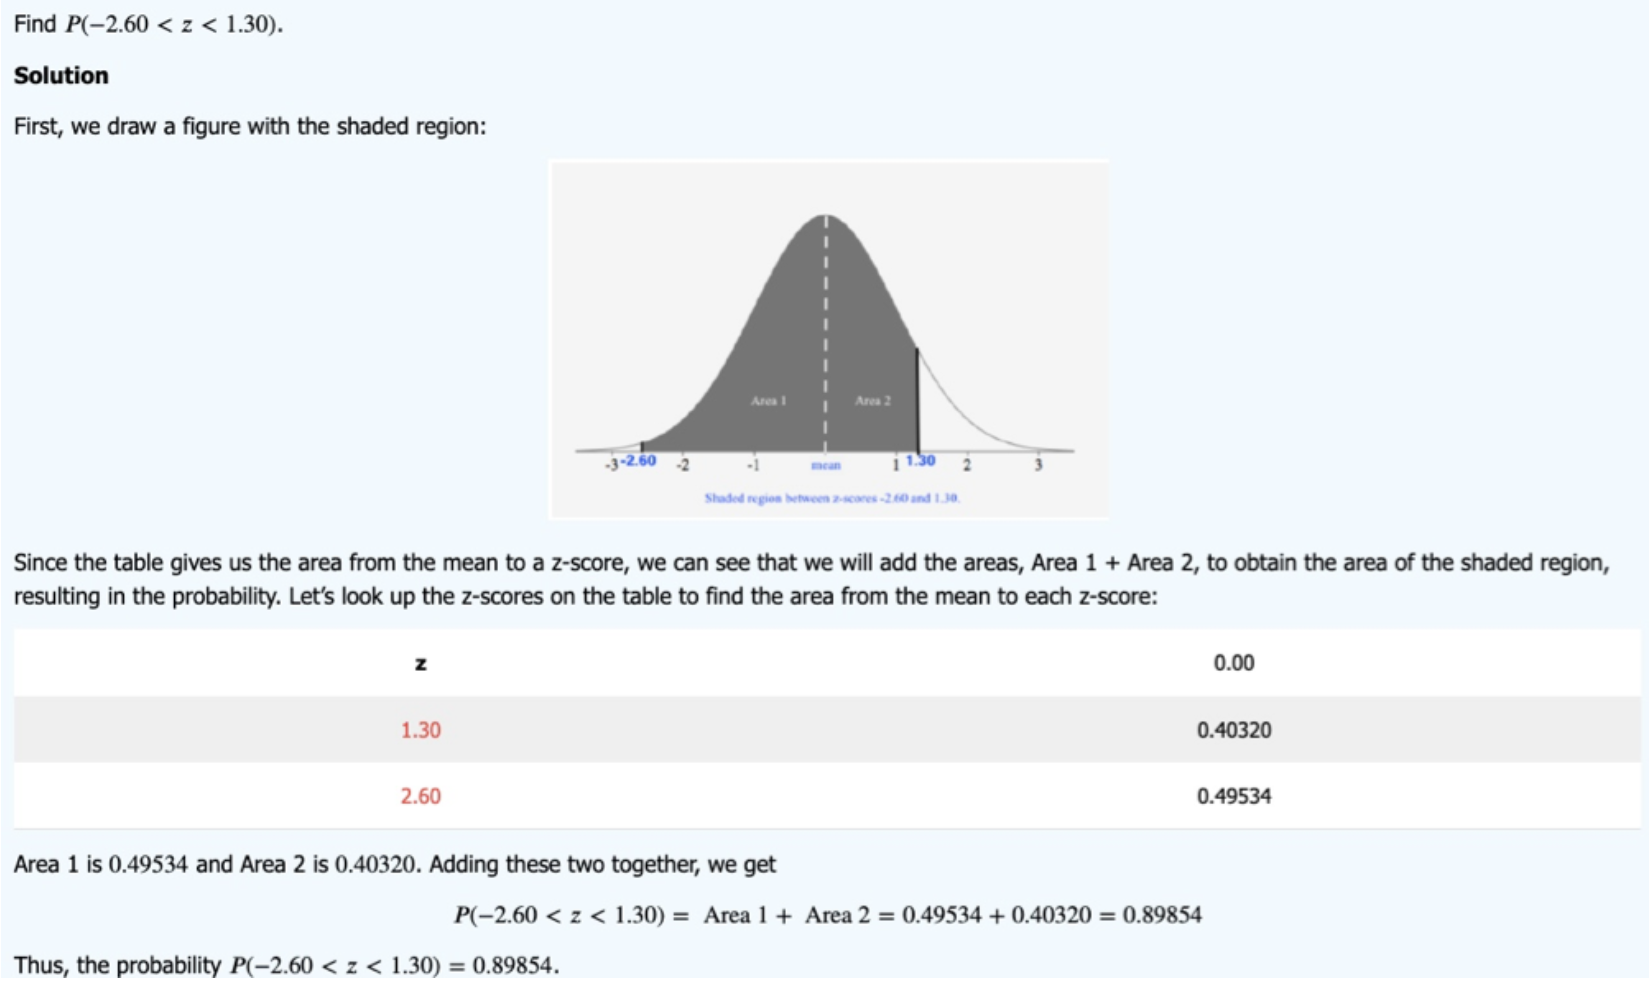
g. Probabilities corresponding to Z-score and areas
In this section we will be focusing on standard normal distribution where mean=0 and standard deviation=1
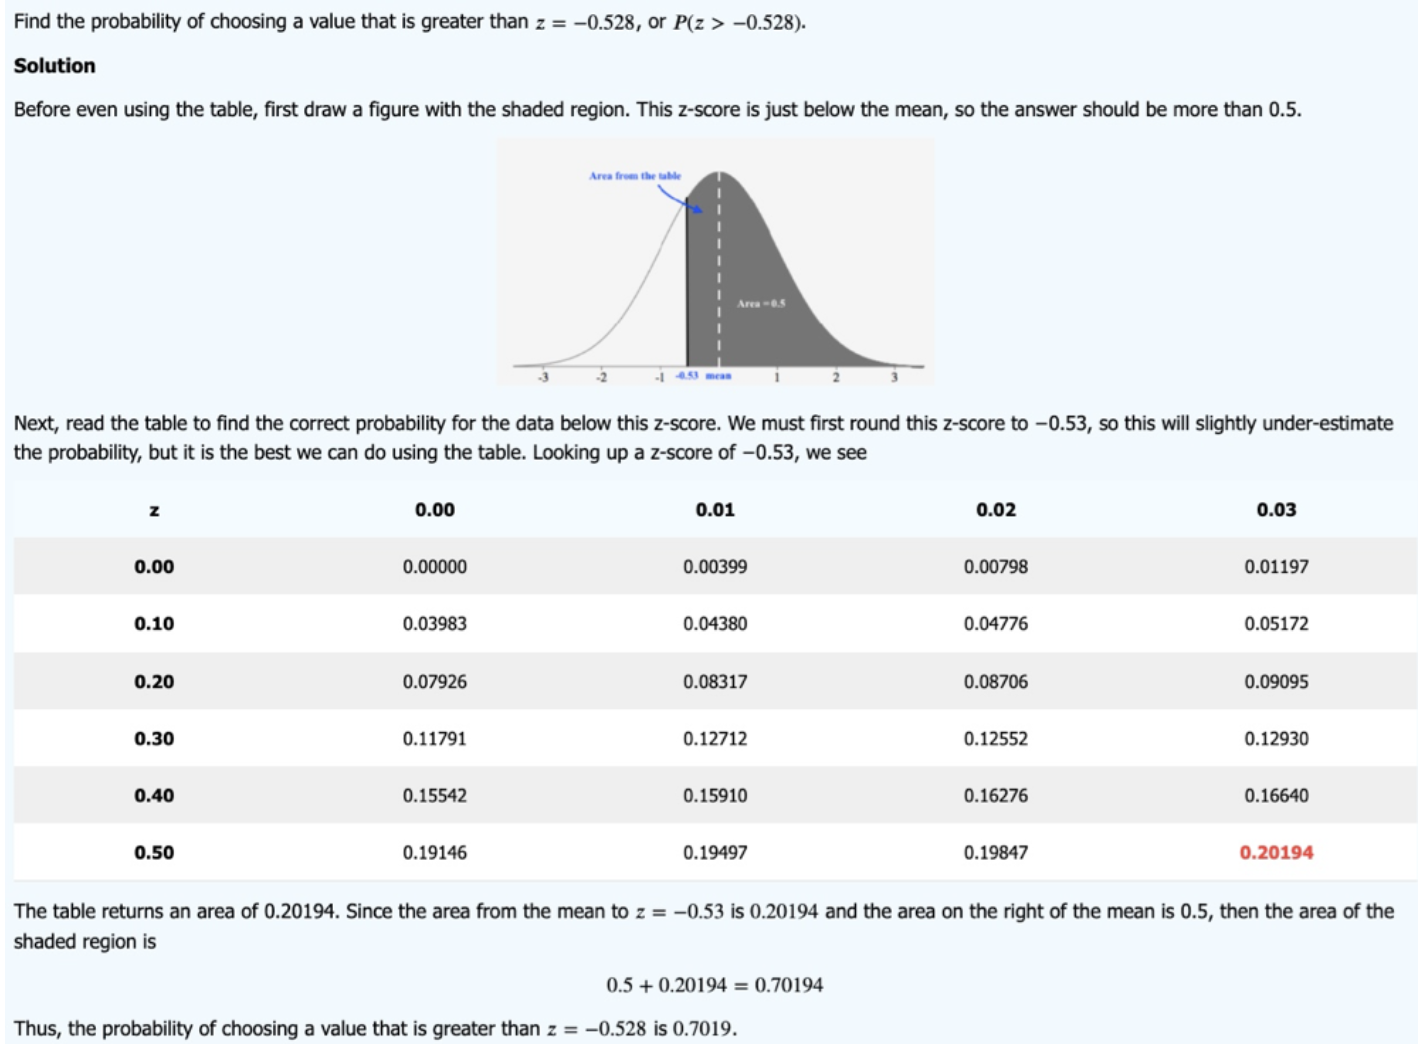
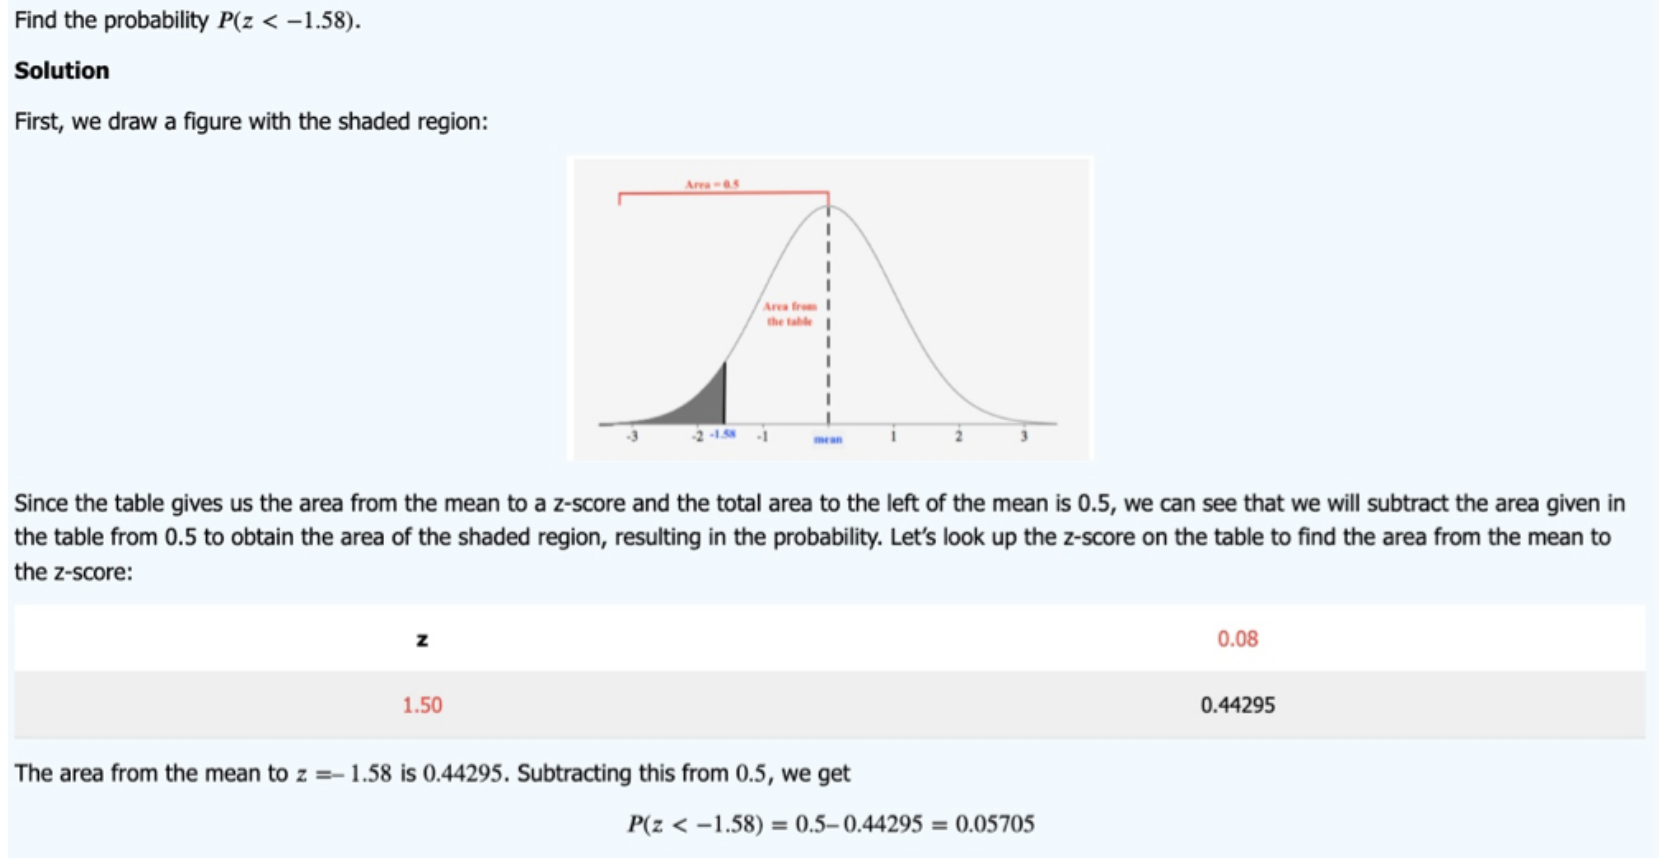
This z-table (normal distribution table) shows the area to the right hand side of the curve from the mean.
Note: There are some z-table which gives area from extreme left than from mean. WATCH OUT
h. Normal distribution Equation

We can also write this as simple as:

Probability of normal distribution at any point is 0. This is because normal distribution is continuous variable. Continuous variable has infinite outcomes. So if you want to find the probability at any certain point, then you will have to divide its number of occurrence with infinite which is zero.
Hence the above equation is applied only for sample and not for the population. Because sample might have finite number of data points which approximates the population. For population we might need to take the integral on the above equation.
i. Few Questions
How do you check if data is normally distributed ?
1. Plot the histogram
2. Sort the data points and calculate the z-score and plot z-scores it should be linear
3. There are few tests like Kolmogorov test for normality
How does cumulative density function look for normal distribution /Standard normal distribution?
References
https://math.libretexts.org/Bookshelves/Applied_Mathematics/Math_For_Liberal_Art_Students_(Diaz)/11%3A_Normal_Distribution https://math.libretexts.org/Bookshelves/Applied_Mathematics/Math_For_Liberal_Art_Students_(Diaz)/ https://math.libretexts.org/Bookshelves/Applied_Mathematics/Math_For_Liberal_Art_Students_(Diaz)/
The law of large numbers, in probability and statistics, states that as a sample size grows, its mean gets closer to the average of the whole population.