Power in Hypothesis testing

In order to understand this blog you should know what is hypothesis testing and intuition behind it. If you are not
familiar with the topic, you can refer to the previous blog Understanding Hypothesis Testing
In this section we will try to understand following things:
1. Types of error in hypothesis testing
2. Power in hypothesis testing
3. Problem on power
1. Types of error in hypothesis testing
In this section we will be discussing types of errors in significance tests. There are 2 types
of errors we can see in significance tests. Those are:
1. Type - I error
2. Type - II error
Lets try to understand these with good example:
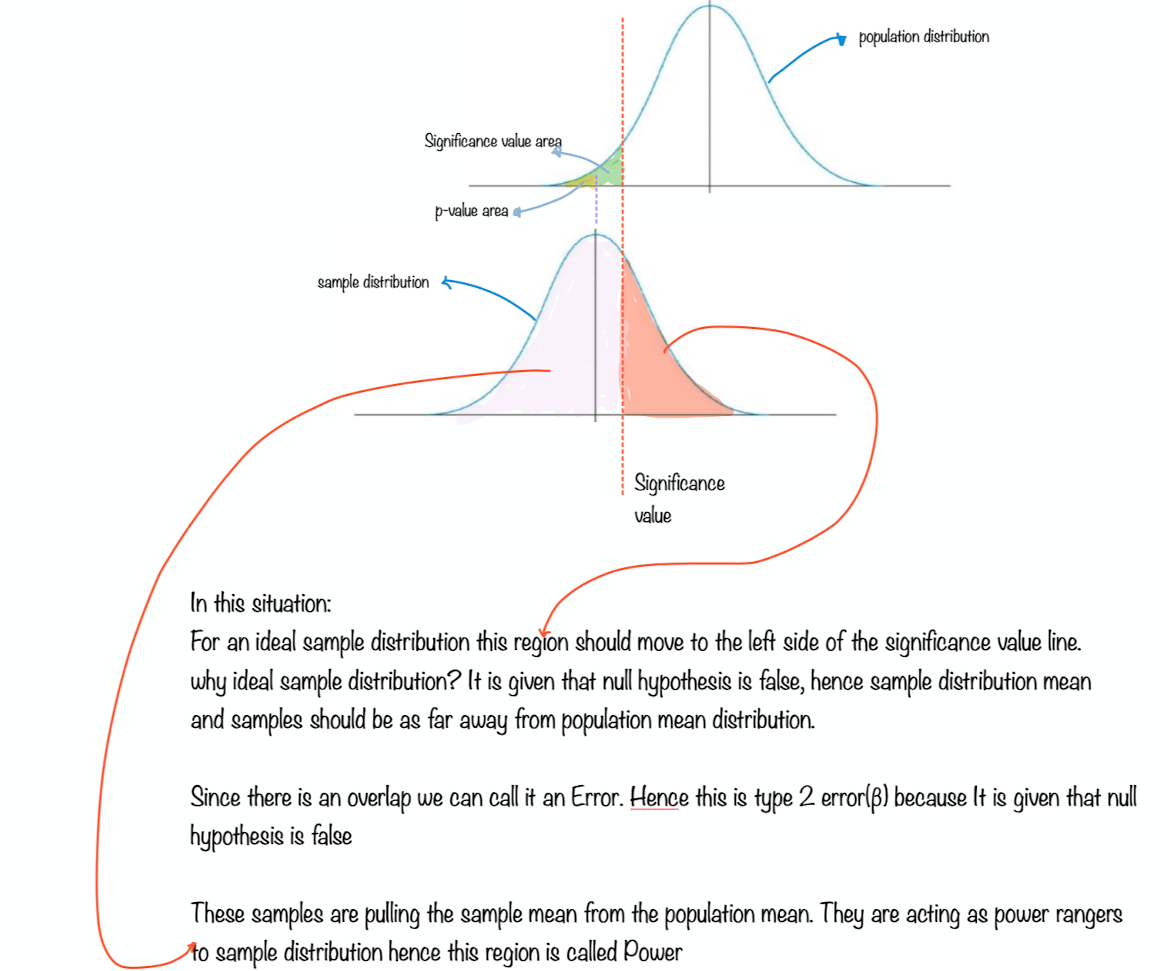
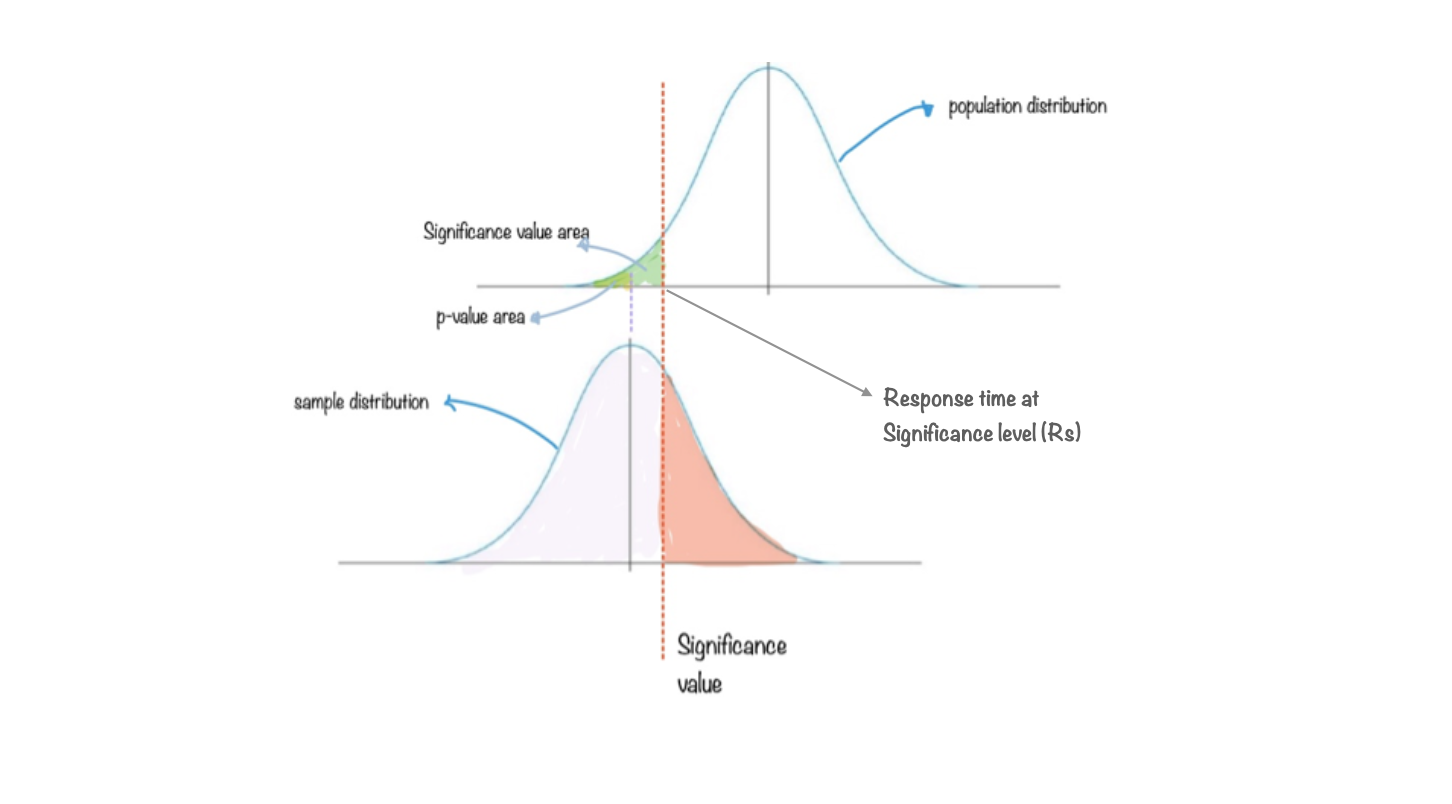
As we can recollect from hypothesis testing, We have 2 distributions: population distribution and
sample distribution. We define a threshold in population distribution. We call it significance level = 0.05 .
Below is the diagram for significance level (or area or probability)
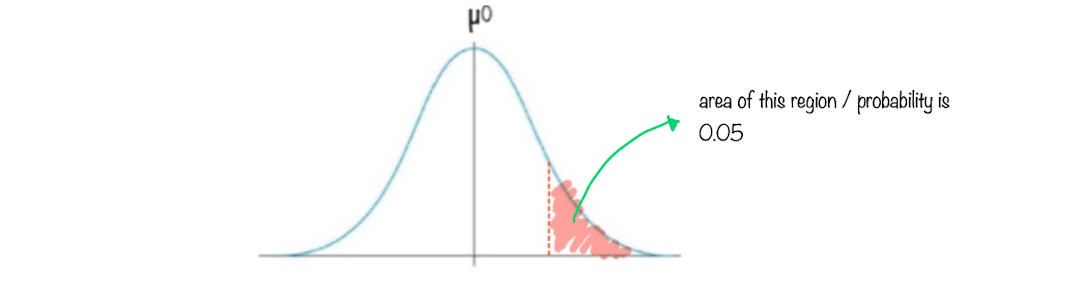
Given threshold for population distribution,
we will compute the probability of seeing mean or any value more than the mean of sample distribution,
in the population distribution
P( x>=mean of sample distribution | population distribution)
We compare this probability with the threshold and we decide whether to accept or reject null hypothesis. If we take too small a region as our threshold there is a high chance that we might end up accepting the null hypothesis and vice versa if we take too big a region as our threshold there is a high chance that we might end up rejecting the null hypothesis.
So what is the ideal region ? Is it 0.05, 0.10 ?
Experiments show 0.05 is a good threshold. but because of this we see some error in our inferential
statistics. Those are Type I and Type II errors
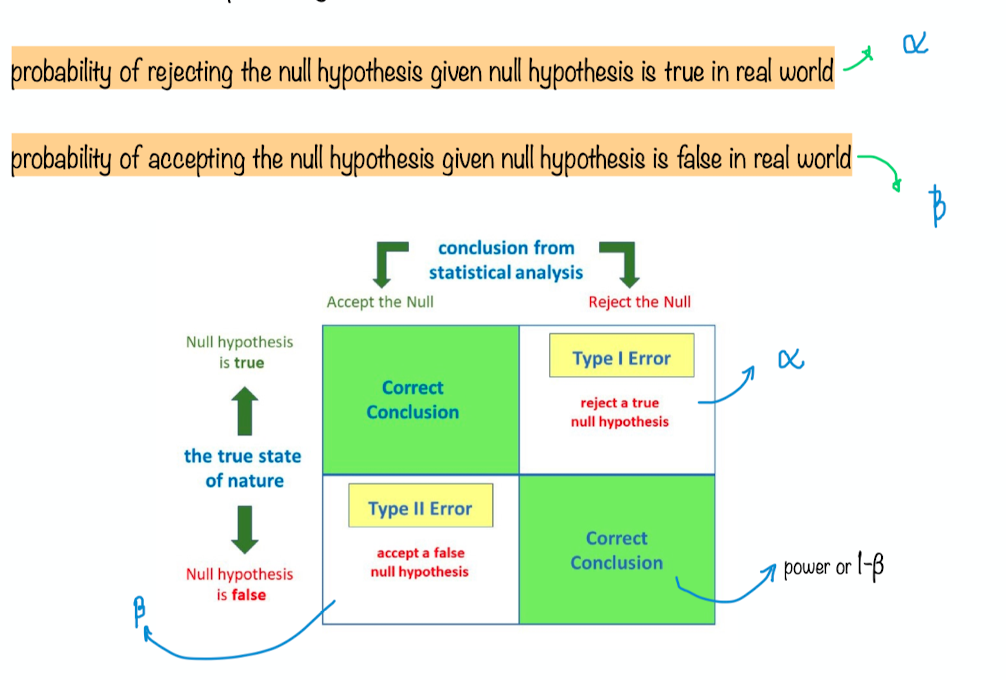
Type I error: If the null hypothesis is true in real world and we end up rejecting the null hypothesis then it is called
Type I error
Type II error: If the null hypothesis is false in the real world and we end up accepting the null hypothesis then it is
called Type II error
So we can associate probability to these 2 statements:
2. Power in hypothesis testing
This is nothing but 1-β that is : Probability of rejecting null hypothesis given null hypothesis is false in
real world
Note: When you build a new version of the apple app and do significance testing we should reject null hypothesis right? Because
the new version is better than the old version. While we are rejecting Power of the test will tell us how confidently we can reject the
null hypothesis. This is because Power is nothing but the probability of rejecting the null hypothesis given null hypothesis is false.
Let's not dive too much into definitions. Let's go ahead and understand power more intuitively.
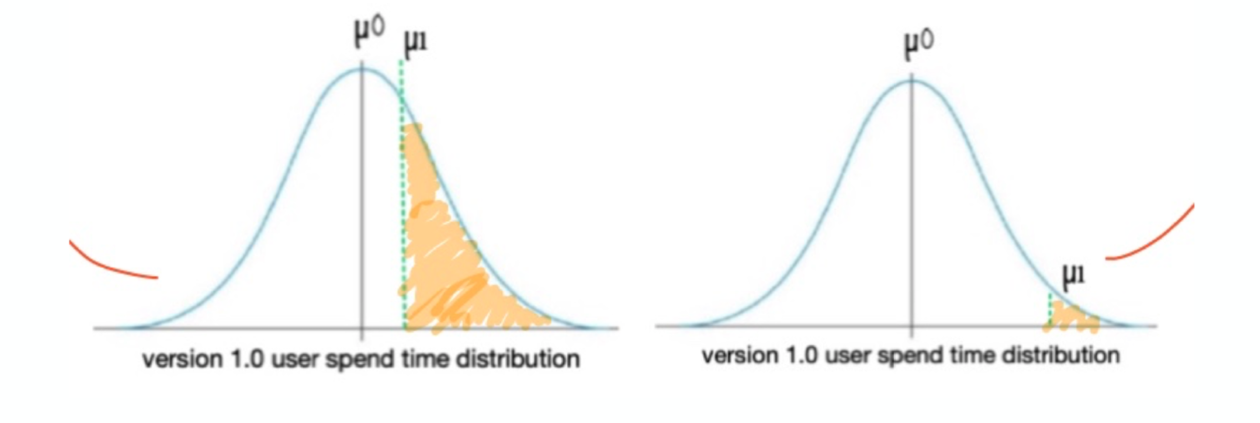
Definition: Power is Probability of rejecting null hypothesis given null hypothesis is false in real world
so we already know that null hypothesis is false,
i.e p-value is less than significant value.
i.e mean of sample distribution is very far from mean of the population distribution
i.e sample distribution is significantly different than population distribution
If we plot this on the graph:
3. Problem on hypothesis testing and power
A api has average response time of 500ms with standard deviation of 25ms. A developer had made
few changes and derived his conclusion on 100 samples that api response time has significantly
reduced to 495ms after his changes. Can you validate this and provide the confidence on validation:
Answer:
Let's define hypothesis
null hypothesis = There is no significant change
alt hypothesis = There is significant reduction in response time
population statistics: μ=500 σ=25
sample statistics: μm=495 n=100
significance level: α=0.05
Calculating z-score
z = (x – μ) / (σ / √n)
= ( 495-500) / ( 25/√100)
z-score= -2.0
Hence observed mean is 2.0 standard-error-of-mean below population mean
Calculating p-value:
p(x>= μm | Null hypothesis is true ) this is called as p-value
We want to calculate the area under normal distribution which is above 2.0 SD away from mean
p-value = Total area above mean - Total area till 3.6 SD above mean
= 0.50 - ztable(2.0)
= 0.50 - 0.4772
p-value = 0.0228
Hence p(x>= μm | Null hypothesis is true ) or p-value is 0.0228
Conclusion:
Since significance level or α > p-value we can reject null hypothesis
Hence there is a significant reduction in the mean of api response time
Now that we have established that null hypothesis is false. Let's find power of the test
i.e Probability of rejecting null hypothesis given null hypothesis is false in real world
First we need to find response time at significance level:
Let's assume response time at significance level is ( Rs )
step 1) Find the area from the population mean to significance level
area = 0.50-0.05
= 0.45
step 2) Let's find out how many SE this point Rs is from population mean.
Refer the z-table and see at what point area is 0.45
Hence,
The significance point is 1.65 SE away from population mean
step 3) Find the significance point or Response time at significance level
SE = σ / √n = 25/10 = 2.5
The significance point is 1.65 SE away from population mean
Hence,
The significance point is 1.65*2.5 response time away from population mean
i.e significant point = 500 - (1.65*2.5)
=495.9
Find the power: From the picture we can see that power = 0.50 + area from mean (495) to 495.9
z-score = ( 495.9-495 )/ ( 25/√100) = 0.36
power = 0.50 + z-table(0.36) = 0.50+0.1406 = 64.06%
References
https://www.youtube.com/watch?v=KS6KEWaoOOE
https://www.youtube.com/watch?v=5ABpqVSx33I
https://www.youtube.com/watch?v=-FtlH4svqx4
https://math.stackexchange.com/questions/1796478/sample-standard-deviation-given-population-standard-deviation
https://www.scribbr.com/methodology/population-vs-sample/#:~:text=A%20population%20is%20the%20entire,t%20always%20refer%20to%20people.
https://towardsdatascience.com/hypothesis-testing-z-scores-337fb06e26ab
https://onlinestatbook.com/2/sampling_distributions/samp_dist_mean.html
https://www.statisticshowto.com/probability-and-statistics/z-score/
https://www.analyticsvidhya.com/blog/2020/06/statistics-analytics-hypothesis-testing-z-test-t-test/
https://math.stackexchange.com/questions/504288/what-situation-calls-for-dividing-the-standard-deviation-by-sqrt-n
hhttps://www.cuemath.com/data/z-test/